'The Daily Activity Summary Report' is used to assess the overall departments activities as well as performance on a given day in comparison to historical results, typically a month-to-date figure.
ACCESSING THE REPORT
Select the 'Reports' tab from the right screen side slider and select the 'The Daily Activity Summary Report' in the 'Cleaning Activity Reports' group.


To Use the The Daily Activity Summary Report:
- To create the report, select the 'Date' from the calendar.
- Select 'Tower' (if applicable).
- Click [Refresh Report].
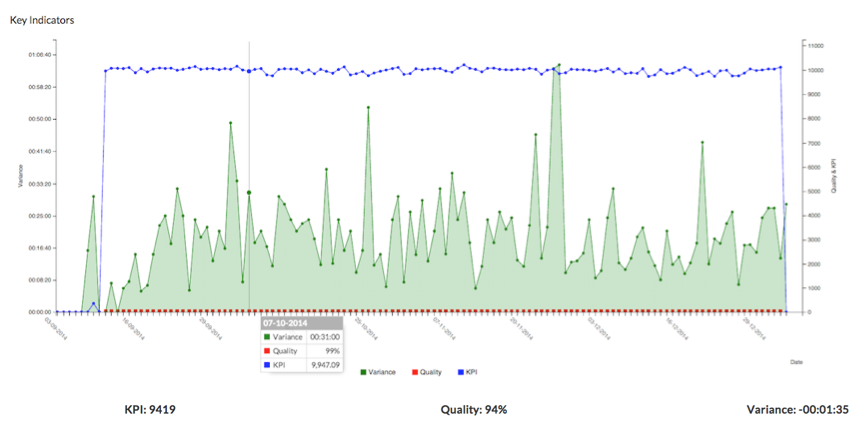
This will display the 'Key Indicators' graph. This graph will display data twelve months from the date selected.


Below is an explanation of how each of the figures in the 'Key Indicators' graph are calculated:
- 'KPI': The Key Performance Indicator is explained in detail in our Help Centre, which you will find here: What is KPI
- 'Quality': This is a percentage which is ((total possible deductions - actual deductions)/ total possible deductions). The deductions come from the Inspection Checklists on the mobile devices and the possible deductions are set in the configuration of inspection items.
- Variance: This is the variance between the actual cleaning time and the estimated cleaning time. A negative value means that Room Attendants clean faster than forecast.
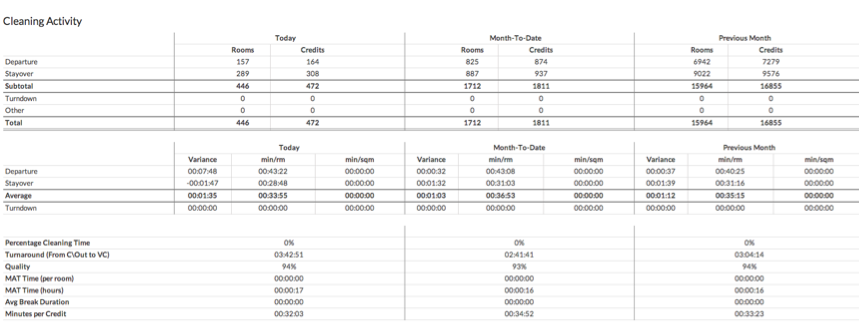
The 'Cleaning Activity' chart displays the current report day's rooms cleaned and credits, the month to date and the previous month's data for Departure, Stayover, Turndowns and other tasks.

- Percentage cleaning time: Length of time the room attendants spend in the rooms cleaning during their shift.
- Turnaround (from C/Out to VC): The time it is taking for rooms to go from a VD to a VC status.
- Quality: The percentage of the quality of all of the cleans for the day.
- MAT time (per room): average of moving around time between the rooms on the same floor.
- MAT time (hours): Total moving around times for all room attendants through out the day.
- Avg break duration: The average break length for all of the room attendants working on that day, this information is recorded when they start and end their breaks on their devices.
- Minutes per credit: The average number of minutes the room attendants have taken to clean the rooms per credit.
The 'Inspection Activity' chart displays the current report date selected, month to date and the previous month's Inspections completed for Departure, Stayover, Checks and the percentage of Inspections completed.

- Turnaround (from VC to VI): Total time from when room status are VC and changed to VI.
- Failed inspections: Percentage of failed inspections for the hotel by the Inspectors.
- Perfect inspections: Percentage of perfect inspections where no issues were recorded by the Inspectors.
- Avg time per inspection: Average length of time the Inspectors spend in the rooms completing the inspections.
- Skipped inspection: The number of skipped inspections by the Inspectors.
This document contains proprietary and confidential information of OPTii Solutions, and is not to be used, copied, or disclosed without written permission. All rights reserved.
-3.png?height=120&name=Optii%20Logo%203x%20(2)-3.png)