-3.png?height=120&name=Optii%20Logo%203x%20(2)-3.png)
The Inspector Benchmark Report provides insight into the performance of your Inspectors - it enables you to gain insights into the capability of each individual and compare them against their peers. In addition, it allows you to gauge how consistent your Supervisors are in performing to brand standards.
The report is structured into three parts:
- Inspector Productivity Benchmarks - Analyze the performance of each Inspector and compare their performance
- Compliance To Standards - How consistent are your Inspectors - i.e., do they perform to a common standard?
- Inspection Item Variations - If the Inspectors tend to differ, which inspection items do they most commonly disagree on?
The expected outcome of competent analysis of this report will result in:
- Faster turnaround of clean arrival rooms
- Improved productivity of Inspectors
- Consistent and improved cleaning quality
- Gaining more accurate data that matches with social media scoring
ACCESSING THE REPORT
Select the 'Reports' tab from Optii menu and select 'Inspector Benchmark Report' in the 'Productivity Reports' group.
To Use the Inspector Benchmark Report:
- Select a 'Start Date' from drop down.
- Select 'End Date' from drop down. NOTE: 'Start Date' will need to be set one day ahead of the desired 'End Date' for data to be computed.(Tip: It may be interesting to compare different periods to observe improvements over time!)
- Select one of several Inspectors in the 'Inspectors' drop-down to view only selected staff. By default, Optii will show you all Inspectors with activity during the selected period.
- Click [Refresh Report].
READING THE REPORT
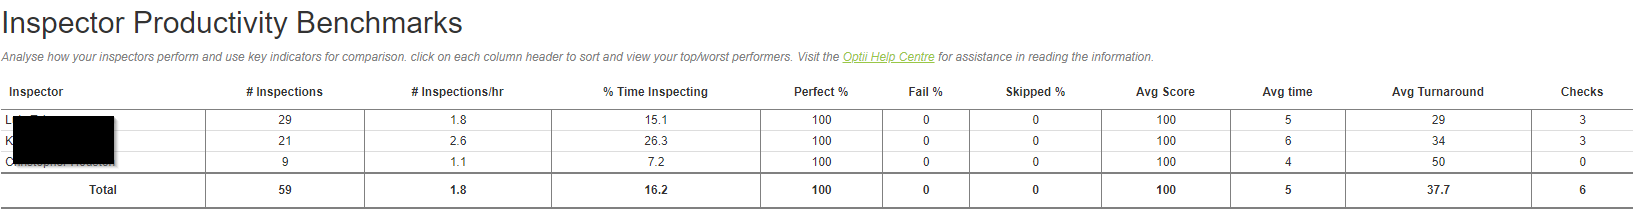
Part 1 - Inspector Productivity Benchmarks
This section allows performance analysis of each Inspector and compare their performance side by side on a variety of criteria:
- # Inspections - the number of Inspections completed during the time frame.
- # Inspections/hr - how many Inspections completed per hour.
- % Time Inspecting - the portion of time spent performing the Inspection.
- Perfect % - the percentage of perfect scores given of total number of inspections.
- Fail % - the percentage of failed scores given of total number of inspections.
- Skipped % - the percentage of skipped inspections out of total number of inspections.
- Avg Score - Average Score for all the rooms that were Inspected
- Avg time - Average amount of time spent on each Inspection
- Avg Turnaround - Length of time until room was ready for guests
- Checks - Number of rooms that were returned to Room Attendants to correct
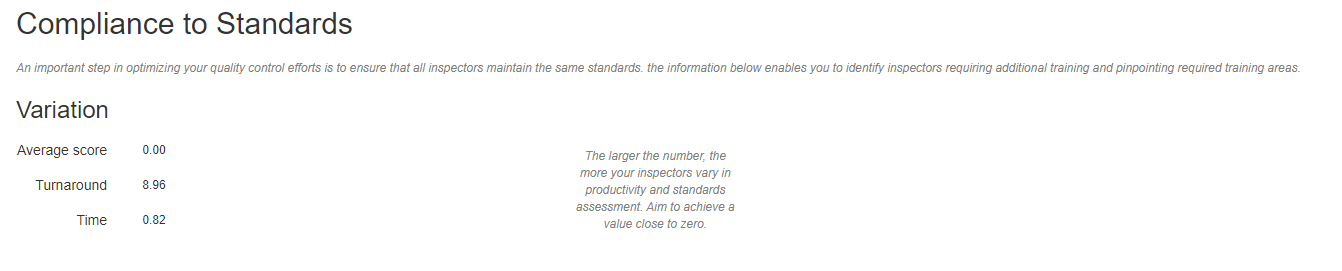
Part 2 - Compliance To Standards
This section lists the variations that are occurring within the supervisory team and these numbers are flexible - there are no hard-fast rules about what constitutes a good or a bad number. What is important, is that these numbers reduce over time. This means that your Inspectors are improving and are increasingly working to the same standards. The compliance numbers are a reflection of the results observed in the 'Inspector Productivity Benchmarks' above and allow you to measure progress over time - seeing whether your hard labour in making your team work better pays off!
For example: A value of '0' for the 'Time' component means that all Inspectors take exactly the same amount of time when checking a room. This will of course never happen in practice, but you should make sure that the values are close to zero and getting less over time.
The three variations being measured are:
- Average score
- Turnaround
- Time
Part 3 - Inspection Item Variations
If you have determined in the 'Compliance to Standards' section that you have a high variation in 'Average Scores' and can observe these variations in 'Inspector Productivity Benchmarks', the question is "What do I do about it? - Where do I start?".
The next step is to train the Inspectors in the cleanliness standards of your property so that all evaluate a Room Attendant's work in the same way.
Optii makes this easy by showing you where your Inspectors currently do not agree and apply varying standards. This section shows you the areas where there is the least consensus between Inspectors - the worst one is the first column on the left, getting better from there.
For example: In the below sample, you can see that the bottom two Inspectors never judge the room to be dusty, while the 2nd and 4th from the top hardly ever NOT find dust. Some obvious training about what constitutes a dusty room is clearly required!
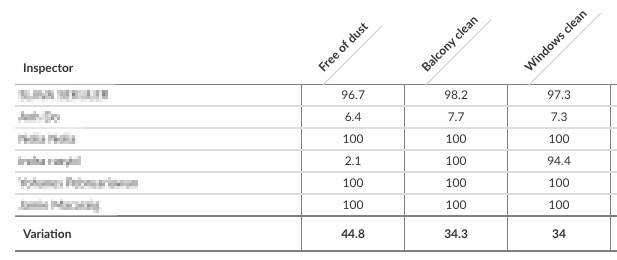
So what should you do? If you focus on the first three columns and train your Inspectors on these items on the floor by taking them to a room and showing them what a room free of dust should be like, what a clean balcony is and what clean windows look like, you will over time see a vast improvement of standards and consistent results! Easy!
This document contains proprietary and confidential information of OPTii Solutions, and is not to be used, copied, or disclosed without written permission. All rights reserved.