The 'Room Attendant Benchmark Report' compares the performance of the room attendants and is assessed by focusing on the KPI, using cleaning time and quality as the central values.
ACCESSING THE REPORT
Select the 'Reports' tab from Optii's menu and select the report 'Room Attendant Benchmark Report' in the 'Performance Reports' group.


To Use the Room Attendant Benchmark Report:
- Select the 'Start Date' from the drop-down.
- Select the 'End Date' from the drop-down.
- Select the 'Tower' (if the hotel has different towers).
- Select 'User Groups' (if desired).
- Click [Refresh Report].

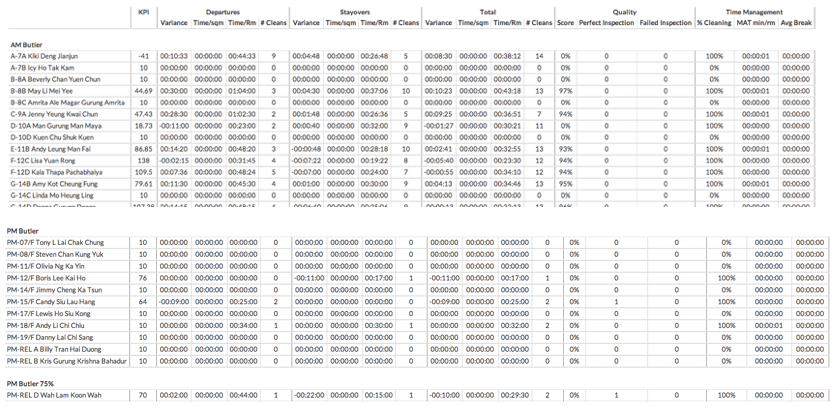
The 'Room Attendant Benchmark Report' will then give you a snapshot of all users' results displayed in the following chart:

- User Groups - outlines the grand totals for each role.
- KPI - indicates the true performance of a Room Attendant and takes into account both the cleaning quality and cleaning speed.
- Departures - the variance between schedule and actual cleaning times, average length of cleaning time per room, number of cleans completed.
- Stayovers - the variance between schedule and actual cleaning times, average length of cleaning time per room, number of cleans completed.
- Total - totals of the Departures and Stayovers.
- Quality - percentage score of the cleans, number of perfect inspections, number of failed inspections.
- Time Management - the percentage of time spent cleaning, MAT (moving around time) between rooms, and average length of break time.
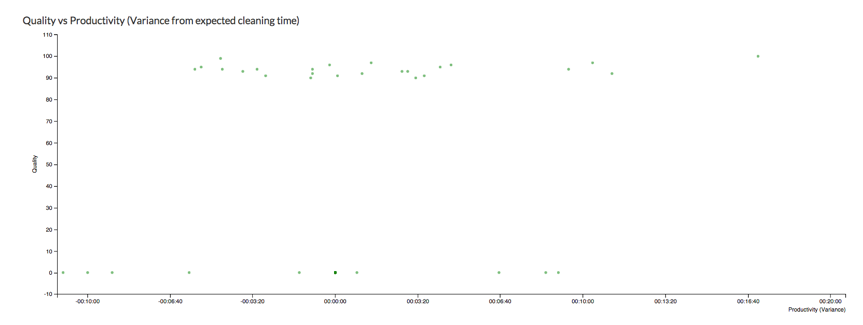
'Quality vs Productivity' graph:
The 'Quality vs Productivity' graph displays how each user is performing their cleans by the Quality (percentage of perfect cleans) and their productivity (difference between scheduled and actual cleaning times). The quality percentage is listed on the vertical axis and the productivity time is the horizontal axis.
'Staff Information' chart
The data is further broken out into a chart that is the same data headers as the first chart listing all of the staff identified in their role (i.e., Room Attendant, Trainee RA, etc.)

Using Data from the 'Staff Information' chart
The chart above can be exported as a .csv file that can be opened in any spreadsheet program for internal use. To access/download the data, simply click [Export To CSV].

This document contains proprietary and confidential information of OPTii Solutions, and is not to be used, copied, or disclosed without written permission. All rights reserved.
-3.png?height=120&name=Optii%20Logo%203x%20(2)-3.png)