-3.png?height=120&name=Optii%20Logo%203x%20(2)-3.png)
The 'Training Needs Analysis Report' provides a detailed insight into the cleaning performance of each individual Room Attendant or the entire team. This report will assist you in measuring your team's performance and highlight areas of strength and opportunity. The results of this report are gathered from the Inspectors/Supervisors when as they conduct thorough inspections and accurately record issues and service failures.
ACCESSING THE REPORT
Select the 'Reports' tab from Optii's menu and select the report 'Training Needs Analysis Report' in the 'Performance Reports' group.
To Use the 'Training Needs Analysis Report':
- Select the 'Start Date' from the drop-down.
- Select the 'End Date' from the drop-down.
- Select specific 'User Group' from the drop-down, if desired, otherwise the report will default to all.
- Select specific 'Room Attendants' from the drop-down, if desired, otherwise the report will default to all.
- Click [Refresh Report].
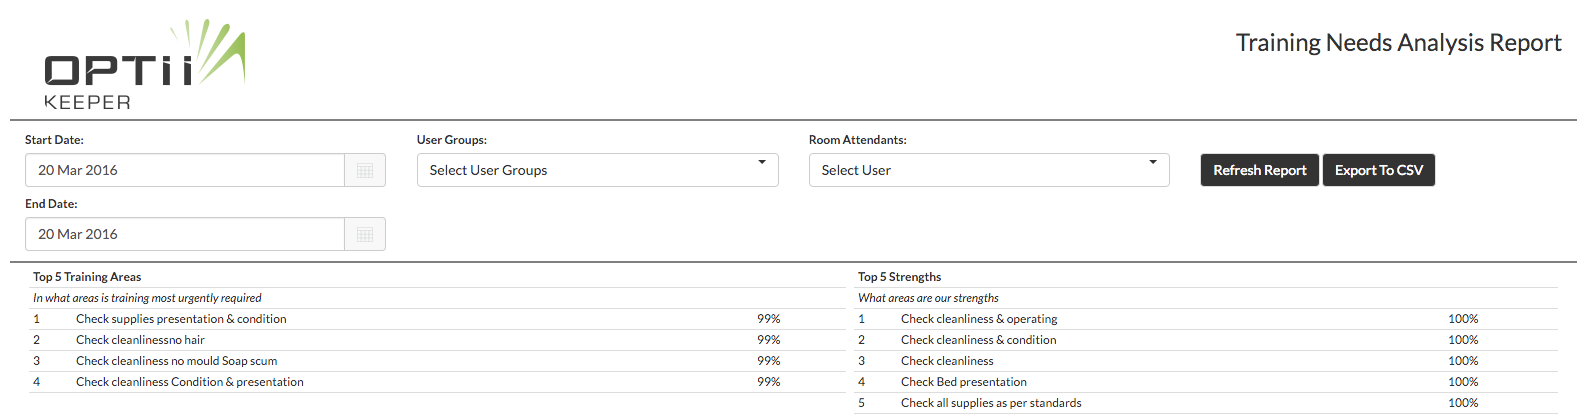
The report will display the following information:
- 'Top 5 Training Areas' - frequently missed checklist items. Training and coaching should be concentrated on these standards.
- 'Top 5 Strengths' - most consistently hit checklist items. The team should be celebrated for success in getting these items right.
This chart gives you a quick snapshot of areas of positive performance as well as areas requiring additional focus and training.

The 'Key Performance Indicators' graph has 3 data points:
- Variance (Green dots) - time variance
- Quality (Red lines)
- KPI (Black dots)
- Date range - noted by dates at the bottom of the graph
KPI:
Quality: This data is populated from the 'Record issues' section of completed inspections.
Variance: The recorded time difference between the 'Scheduled' and 'Actual' cleaning times.
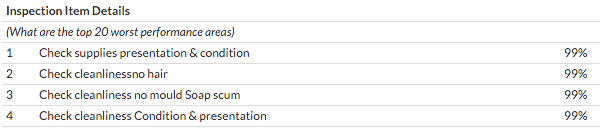
The 'Inspection Item Details' chart outlines the most frequent 20 standards or inspection items that have been failed from inspections within the selected date range. This list is designed to highlight opportunities for individuals or the team to improve their cleaning performance.
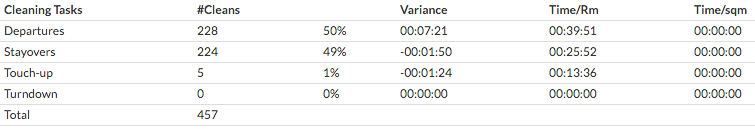
The 'Cleaning Tasks' chart displays the following information:
- Cleaning Tasks - the type of clean performed - Departures, Stayovers, Touch-Ups, or Turndowns
- #Cleans - the number of tasks completed per cleaning type
- Percentage - the percentage of each type of task performed during the selected date range
- Variance - the time differential between the 'Scheduled' and 'Actual' cleaning times
- Time/Rm - the average time spent in the room per cleaning task
- Time/sqm - the average time per square meter (generally not in use, unless property specifies square meters of rooms during Optii configuration)
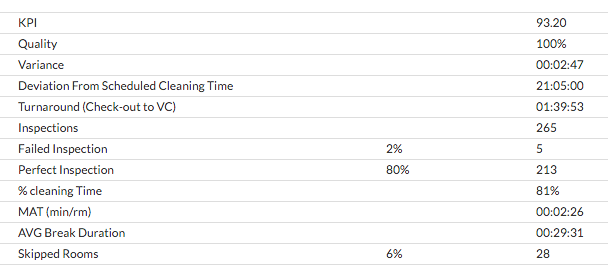
The Summary chart displays the following information:
Complete snapshot of the selected report time frame that includes the above information plus the Quality of Inspections and MAT (moving around time) recorded between rooms and floors.
This document contains proprietary and confidential information of OPTii Solutions, and is not to be used, copied, or disclosed without written permission. All rights reserved.